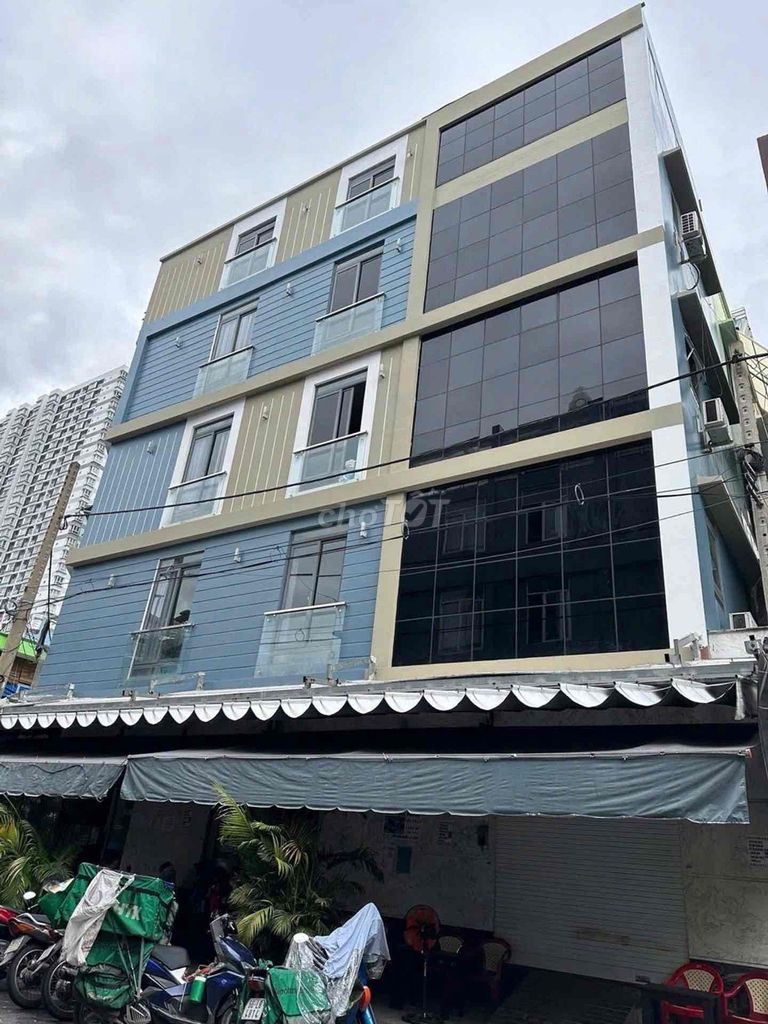
House for sale in 6, TP. Hồ Chí Minh

27,800,000,000 VND

House · For sale · 6, TP. Hồ Chí Minh · 90 m² (land) · 8 bd

House in 6, TP. Hồ Chí Minh - photo 1House in 6, TP. Hồ Chí Minh - photo 2House in 6, TP. Hồ Chí Minh - photo 3House in 6, TP. Hồ Chí Minh - photo 4House in 6, TP. Hồ Chí Minh - photo 5

Property details

TypeHouse
Listing typeFor sale
Area90 m² (land)
Bedrooms8
Bathrooms6
Unit price308,888,889 VND/m² (land)
Location6, TP. Hồ Chí Minh

Source listing title

CĂN GÓC ĐƯỜNG SỐ 23-Hiếm 5x20m-KHU BÌNH PHÚ Q6

Original source

↗ Open original listing

Contact the seller

Contact the seller on the source ↗

Giá Thật has no public phone number recorded for this listing; the seller is reached through the original listing on nhatot.com. On Nhà Tốt the phone number appears after pressing “show number”.

Share this listing

Price summary (for reference)

Technical details

Province-wide asking-price context — snapshot of the current package (observations 30/08/2026 – 01/09/2026)

Broad current-supply context for this transaction only—not a valuation or an individual-property history. THIS BLOCK is province-wide and combines every property type, so it is deliberately not joined to typed historical evidence. The property type used further down, House, is taken from the source’s own category field — not an independently verified canonical field.

Broad current market context · All current listings for ONE transaction across the province, property types combined. Not a valuation.

TransactionFor sale
As ofObservations 30/08/2026 – 01/09/2026 (package 5e5e15a7; the same package as the comparable basket below)
Province/cityTP. Hồ Chí Minh
Current listings4,680
Rounded median asking price6 B VND
Middle 50% total asking price3.8 B VND – 8.4 B VND
Usable price observations4,180
Unknown asking price0

Observed listing asking prices only; Tukey 1.5×IQR filtering. SALE and RENT stay separate. No interpolation, transaction/declaration prices, tax/notarial values or government price table.

Comparable asking prices — 2026-Q3 snapshot (observed 30/08/2026 – 01/09/2026; GIÁ THẬT observations)

This listing's asking price per m²308.9 M VND/m² (separate marker, not part of the basket)
Comparable basket, weighted median83 M VND/m² — 2026-Q3 (observed 30/08/2026 – 01/09/2026) · 357 comparables · province-wide
Middle 50% of comparables (p25–p75)61.9 M VND/m² – 109.5 M VND/m²
Where this listing sitswell above the middle band (+272.4% vs weighted median)
Comparables used357 (15 outliers removed)
Observation period2026-Q3 (30/08/2026 → 01/09/2026)
CohortHouse · For sale · 80–110 m² · same province — no district was found in this listing's title or description, so the comparison is province-wide; the listing's stated district (6) is not used by this comparison
Confidencemedium (3/12 factors demonstrated, effective n 286.2)

Estimated range for this property's area: 5.57 bn VND – 9.86 bn VND (median 7.47 bn VND). This is an ESTIMATE derived from the comparable basket × the stated area — not an observed price, not a valuation, not a transaction price. Basis: basket p25 – p75 of the 2026-Q3 snapshot (observed 30/08/2026 – 01/09/2026) × 90 m² stated area.

Features that weighted this basket (stated by both this listing and the comparables): area · frontage width · evidence quality

Not stated by this listing, so not used: main street / alley · alley width · car access · floors · bedrooms · legal status · ward · street. Unknown is never counted as a match; it lowers the confidence.

Stated here but too few comparables state it: corner position

Asking-price observations collected by GIÁ THẬT from public listings, SALE and RENT kept apart; weighted median after a log-space Tukey 1.5×IQR fence; no interpolation, no government, tax, notarial or declared-transaction values. Comparable evidence, not this property's own history.

Asking-price context

Comparable asking range (earlier per-listing estimate, listing observed 11/08/2026)11.4 B VND – 25.7 B VND
Current asking price27,800,000,000 VND

Separate, earlier per-listing estimate retained from the static package; it is not the dated comparable basket shown above and carries no cohort or period of its own.

Asking-price evidence from comparable listings in this area/segment; not an individual-property valuation and not a transaction price.

Comparable market asking-price history

Comparable-market timeline (GIÁ THẬT observations, 2020-Q3 → 2026-Q4; province-wide, same type · transaction · area band)

2026-Q4 is the current quarter, partial (observations through 2026-10-21); its point is not a full-quarter figure.

One point per quarter: the weighted median asking VND/m² of comparable listings GIÁ THẬT itself observed (same type, transaction, area band, same province; the same attribute weights as the recent basket). Real dated observations only: nothing is interpolated, backcast or merged with the archive series below. Quarters without a defensible basket draw no point (7 of 28 quarters in the index): 2020-Q1, 2020-Q2, 2020-Q4, 2021-Q1, 2021-Q3, 2022-Q1, 2022-Q4.

Comparable series matched to this property · Selected on location, property type, transaction and area band, and weighted. Still market evidence, not this property's own sale history.

0100M200M300M2020-Q3 · Weighted median 54.3M VND/m² · P25 - P75 of comparable asking prices: 12.6M VND/m² – 80.2M VND/m² · Observations 12 · First period - no prior period to compare2021-Q2 · Weighted median 94.4M VND/m² · P25 - P75 of comparable asking prices: 73.8M VND/m² – 118.8M VND/m² · Observations 10 · Not comparable - the preceding period is missing from the evidence, and the gap is preserved2021-Q4 · Weighted median 142M VND/m² · P25 - P75 of comparable asking prices: 60.7M VND/m² – 162.8M VND/m² · Observations 10 · Not comparable - the preceding period is missing from the evidence, and the gap is preserved2022-Q2 · Weighted median 103.8M VND/m² · P25 - P75 of comparable asking prices: 70.3M VND/m² – 125M VND/m² · Observations 33 · Not comparable - the preceding period is missing from the evidence, and the gap is preserved2022-Q3 · Weighted median 75M VND/m² · P25 - P75 of comparable asking prices: 61.3M VND/m² – 208.3M VND/m² · Observations 12 · Fell 27.7% vs 2022-Q22023-Q1 · Weighted median 81.1M VND/m² · P25 - P75 of comparable asking prices: 61.9M VND/m² – 98.8M VND/m² · Observations 40 · Not comparable - the preceding period is missing from the evidence, and the gap is preserved2023-Q2 · Weighted median 66.7M VND/m² · P25 - P75 of comparable asking prices: 45M VND/m² – 93.8M VND/m² · Observations 72 · Fell 17.8% vs 2023-Q12023-Q3 · Weighted median 85M VND/m² · P25 - P75 of comparable asking prices: 48.2M VND/m² – 136.8M VND/m² · Observations 58 · Rose 27.5% vs 2023-Q22023-Q4 · Weighted median 65.6M VND/m² · P25 - P75 of comparable asking prices: 53.3M VND/m² – 84M VND/m² · Observations 89 · Fell 22.8% vs 2023-Q32024-Q1 · Weighted median 69.8M VND/m² · P25 - P75 of comparable asking prices: 56.5M VND/m² – 105M VND/m² · Observations 73 · Rose 6.3% vs 2023-Q42024-Q2 · Weighted median 61.9M VND/m² · P25 - P75 of comparable asking prices: 44.1M VND/m² – 107.1M VND/m² · Observations 72 · Fell 11.3% vs 2024-Q12024-Q3 · Weighted median 88.1M VND/m² · P25 - P75 of comparable asking prices: 58M VND/m² – 140M VND/m² · Observations 286 · Rose 42.4% vs 2024-Q22024-Q4 · Weighted median 81.1M VND/m² · P25 - P75 of comparable asking prices: 62.4M VND/m² – 102.9M VND/m² · Observations 124 · Fell 7.9% vs 2024-Q32025-Q1 · Weighted median 75.3M VND/m² · P25 - P75 of comparable asking prices: 60M VND/m² – 134.4M VND/m² · Observations 44 · Fell 7.2% vs 2024-Q42025-Q2 · Weighted median 71.7M VND/m² · P25 - P75 of comparable asking prices: 47.5M VND/m² – 96.7M VND/m² · Observations 275 · Fell 4.7% vs 2025-Q12025-Q3 · Weighted median 104.7M VND/m² · P25 - P75 of comparable asking prices: 81.3M VND/m² – 131.1M VND/m² · Observations 248 · Rose 46.0% vs 2025-Q22025-Q4 · Weighted median 96.6M VND/m² · P25 - P75 of comparable asking prices: 73.9M VND/m² – 127.7M VND/m² · Observations 126 · Fell 7.8% vs 2025-Q32026-Q1 · Weighted median 90M VND/m² · P25 - P75 of comparable asking prices: 75M VND/m² – 110M VND/m² · Observations 70 · Fell 6.8% vs 2025-Q42026-Q2 · Weighted median 103.5M VND/m² · P25 - P75 of comparable asking prices: 78.1M VND/m² – 154.2M VND/m² · Observations 283 · Rose 15.0% vs 2026-Q12026-Q3 · Weighted median 93.5M VND/m² · P25 - P75 of comparable asking prices: 70M VND/m² – 153.8M VND/m² · Observations 290 · Fell 9.7% vs 2026-Q22026-Q4 · Weighted median 107.5M VND/m² · P25 - P75 of comparable asking prices: 75.6M VND/m² – 173.8M VND/m² · Observations 282 · Rose 15.1% vs 2026-Q3this property 308.9M VND/m²2020-Q32022-Q32023-Q42024-Q42025-Q42026-Q4VND/m²
0100M200M300Mthis property 308.9M VND/m²2020-Q32024-Q22026-Q4VND/m²
weighted median roseweighted median fellunchanged
Period
2026-Q4
Weighted median
107.5M VND/m²
P25 - P75 of comparable asking prices
75.6M VND/m² – 173.8M VND/m²
Observations
282
Direction
Rose 15.1% vs 2026-Q3
Matching level
same province
Confidence
medium (0.53)
Geography
Ho Chi Minh City
Property type
House
Transaction
For sale
Evidence class
Dated asking prices observed by Giá Thật

Tap or hover a period to read its figures here.

weighted median roseweighted median fellunchangedno preceding period (line breaks at a gap)P25-P75 of comparable asking pricesthis property
2025-Q175.3M VND/m² · 44 listings · confidence low
2025-Q271.7M VND/m² · 275 listings · confidence medium
2025-Q3104.7M VND/m² · 248 listings · confidence medium
2025-Q496.6M VND/m² · 126 listings · confidence medium
2026-Q190M VND/m² · 70 listings · confidence medium
2026-Q2103.5M VND/m² · 283 listings · confidence medium
2026-Q393.5M VND/m² · 290 listings · confidence medium
2026-Q4107.5M VND/m² · 282 listings · confidence low

Methodology boundary. The series below this line is the ARCHIVE comparable basket (historical package, pre-2021 asking observations, its own basket construction). It is kept as evidence and is NOT stitched onto the timeline above.

Comparable-market evidence selected for this property. It is not this individual property's own transaction history. Evidence classes are shown separately, gaps are preserved and nothing is interpolated. Government, tax and notarial prices are excluded.

Recent context

2026-07 · 102M VND/m² — median across the property types available for this district, with the type spread; a BROADER match than a single typed series and labelled as such · batdongsan.com.vn

Latest period: 2026-07Geography: 6, Hcmc (same district as this listing)Property type: all property types combined — broader than this listing's type (House)Transaction: For saleSample basis: 1 contributing typed series in the latest period (no listing-level sample size published)

The full series is charted below under “Wider area history” (first block). The older archive (to 2020-Q3) is shown separately below and is never joined to it.

* 20Y is unavailable: the observed evidence spans 15 years.

Matched: Comparable basket matched to this propertyLatest evidence: 2020-Q3Based on: 992 comparables from 835 distinct listingsConfidence: medium

This series is archived: its newest observation is 2020-Q3, about 72 months before the most recent evidence Giá Thật holds. It describes the market of that period, not today's asking prices.

Comparable basket matched to this property — HCMC · private_house · SALE · 80-110m2

Span 2012-Q4 – 2020-Q3 (7.75 years) · 992 comparables from 835 distinct listings · VND/m²

This property's current asking price: 308.9M VND/m² (shown as the dashed marker, not as a point in the series)

Features that selected and weighted this basket: province: HCMC · property type: House · transaction: SALE · area similarity: 80-110m2 (90 m²) · evidence quality

Not available in this evidence, so not used: road / access width · frontage width · corner position · floors / bedrooms / condition · legal / ownership evidence · depth / shape. These lower the confidence below; they are never counted as matches.

weighted median of observed asking price per m2 per calendar quarter; weight = area_similarity x evidence_quality, and low/high are WEIGHTED p25/p75 computed with those same weights; recency is carried by the quarter bucket itself rather than by a within-bucket factor, and the locality/project signal the pool carries is deliberately NOT in the weight because using it would move published medians without re-validation; low/high are p25/p75 of the weighted comparables in that quarter

This property's own asking price is NOT placed inside the distribution below. This cohort demonstrates 5 of the 6 contract components it could, which is not enough to say where this particular property sits. The comparable evidence itself is shown in full; only the positional claim is withheld.

Comparable series matched to this property · Selected on location, property type, transaction and area band, and weighted. Still market evidence, not this property's own sale history.

050M100M150M200M2012-Q4 · Weighted median 22.2M VND/m² · P25 - P75 of comparable asking prices: 19.4M VND/m² – 29.9M VND/m² · Comparables 3 · First period - no prior period to compare2013-Q1 · Weighted median 32.5M VND/m² · P25 - P75 of comparable asking prices: 16.7M VND/m² – 59.4M VND/m² · Comparables 47 · Rose 46.7% vs 2012-Q42013-Q2 · Weighted median 37.5M VND/m² · P25 - P75 of comparable asking prices: 21.6M VND/m² – 69.9M VND/m² · Comparables 68 · Rose 15.4% vs 2013-Q12013-Q3 · Weighted median 34.6M VND/m² · P25 - P75 of comparable asking prices: 17.2M VND/m² – 78.7M VND/m² · Comparables 80 · Fell 7.7% vs 2013-Q22013-Q4 · Weighted median 36.1M VND/m² · P25 - P75 of comparable asking prices: 26M VND/m² – 75.5M VND/m² · Comparables 61 · Rose 4.2% vs 2013-Q32014-Q1 · Weighted median 38.3M VND/m² · P25 - P75 of comparable asking prices: 21.3M VND/m² – 94.1M VND/m² · Comparables 63 · Rose 6.2% vs 2013-Q42014-Q2 · Weighted median 21.2M VND/m² · P25 - P75 of comparable asking prices: 20.3M VND/m² – 30.1M VND/m² · Comparables 16 · Fell 44.7% vs 2014-Q12014-Q3 · Weighted median 33.1M VND/m² · P25 - P75 of comparable asking prices: 15.8M VND/m² – 75M VND/m² · Comparables 33 · Rose 56.3% vs 2014-Q22015-Q1 · Weighted median 25.2M VND/m² · P25 - P75 of comparable asking prices: 14.9M VND/m² – 50M VND/m² · Comparables 70 · Not comparable - the preceding period is missing from the evidence, and the gap is preserved2015-Q2 · Weighted median 38.9M VND/m² · P25 - P75 of comparable asking prices: 15M VND/m² – 77.4M VND/m² · Comparables 31 · Rose 54.3% vs 2015-Q12015-Q3 · Weighted median 45.4M VND/m² · P25 - P75 of comparable asking prices: 21.5M VND/m² – 71.5M VND/m² · Comparables 41 · Rose 16.8% vs 2015-Q22015-Q4 · Weighted median 45M VND/m² · P25 - P75 of comparable asking prices: 24.4M VND/m² – 90.6M VND/m² · Comparables 77 · Materially unchanged vs 2015-Q32016-Q1 · Weighted median 31.3M VND/m² · P25 - P75 of comparable asking prices: 18M VND/m² – 62M VND/m² · Comparables 61 · Fell 30.6% vs 2015-Q42016-Q2 · Weighted median 47.4M VND/m² · P25 - P75 of comparable asking prices: 47.4M VND/m² – 90M VND/m² · Comparables 6 · Rose 51.6% vs 2016-Q12016-Q4 · Weighted median 35.6M VND/m² · P25 - P75 of comparable asking prices: 26M VND/m² – 80M VND/m² · Comparables 28 · Not comparable - the preceding period is missing from the evidence, and the gap is preserved2017-Q2 · Weighted median 47.5M VND/m² · P25 - P75 of comparable asking prices: 31.3M VND/m² – 102.1M VND/m² · Comparables 33 · Not comparable - the preceding period is missing from the evidence, and the gap is preserved2017-Q3 · Weighted median 28.4M VND/m² · P25 - P75 of comparable asking prices: 16M VND/m² – 46.2M VND/m² · Comparables 27 · Fell 40.2% vs 2017-Q22017-Q4 · Weighted median 114.8M VND/m² · P25 - P75 of comparable asking prices: 105M VND/m² – 138.9M VND/m² · Comparables 3 · Rose 304.1% vs 2017-Q32018-Q1 · Weighted median 155.6M VND/m² · P25 - P75 of comparable asking prices: 118.5M VND/m² – 189.3M VND/m² · Comparables 6 · Rose 35.5% vs 2017-Q42018-Q2 · Weighted median 85.2M VND/m² · P25 - P75 of comparable asking prices: 78.8M VND/m² – 86.7M VND/m² · Comparables 5 · Fell 45.2% vs 2018-Q12018-Q4 · Weighted median 55.6M VND/m² · P25 - P75 of comparable asking prices: 28.2M VND/m² – 186.3M VND/m² · Comparables 12 · Not comparable - the preceding period is missing from the evidence, and the gap is preserved2019-Q2 · Weighted median 62.1M VND/m² · P25 - P75 of comparable asking prices: 44.3M VND/m² – 103.4M VND/m² · Comparables 27 · Not comparable - the preceding period is missing from the evidence, and the gap is preserved2019-Q3 · Weighted median 87.3M VND/m² · P25 - P75 of comparable asking prices: 56.8M VND/m² – 200M VND/m² · Comparables 59 · Rose 40.5% vs 2019-Q22019-Q4 · Weighted median 69M VND/m² · P25 - P75 of comparable asking prices: 57.8M VND/m² – 146.7M VND/m² · Comparables 52 · Fell 20.9% vs 2019-Q32020-Q1 · Weighted median 119M VND/m² · P25 - P75 of comparable asking prices: 68.8M VND/m² – 200M VND/m² · Comparables 46 · Rose 72.4% vs 2019-Q42020-Q2 · Weighted median 73.1M VND/m² · P25 - P75 of comparable asking prices: 44.3M VND/m² – 112.5M VND/m² · Comparables 27 · Fell 38.6% vs 2020-Q12020-Q3 · Weighted median 71.8M VND/m² · P25 - P75 of comparable asking prices: 60.9M VND/m² – 122.2M VND/m² · Comparables 10 · Fell 1.9% vs 2020-Q22012-Q42014-Q12015-Q32017-Q32019-Q22020-Q3VND/m²
050M100M150M200M2012-Q42016-Q22020-Q3VND/m²
weighted median roseweighted median fellunchanged
Period
2020-Q3
Weighted median
71.8M VND/m²
P25 - P75 of comparable asking prices
60.9M VND/m² – 122.2M VND/m²
Comparables
10
Distinct listings behind it
10
Direction
Fell 1.9% vs 2020-Q2
Matching level
Comparable basket matched to this property
Confidence
medium (0.42)
Geography
Ho Chi Minh City
Property type
House
Transaction
For sale
Evidence class
Archived asking prices

Tap or hover a period to read its figures here.

weighted median roseweighted median fellunchangedno preceding period (line breaks at a gap)weak sample (n≤3), still shownP25-P75 of comparable asking prices
2018-Q285.2M VND/m² (78.8M VND/m² – 86.7M VND/m²) · n=5
2018-Q455.6M VND/m² (28.2M VND/m² – 186.3M VND/m²) · n=12
2019-Q262.1M VND/m² (44.3M VND/m² – 103.4M VND/m²) · n=27
2019-Q387.3M VND/m² (56.8M VND/m² – 200M VND/m²) · n=59
2019-Q469M VND/m² (57.8M VND/m² – 146.7M VND/m²) · n=52
2020-Q1119M VND/m² (68.8M VND/m² – 200M VND/m²) · n=46
2020-Q273.1M VND/m² (44.3M VND/m² – 112.5M VND/m²) · n=27
2020-Q371.8M VND/m² (60.9M VND/m² – 122.2M VND/m²) · n=10

Confidence: medium (0.4167) · confidence is capped by demonstrated specificity: 5 of 12 contract score components are effective for THIS cohort. A component absent from this cohort - a district that was never matched, for instance - is not counted, and recency is not counted because it is carried by the quarter bucket rather than by a within-bucket weight.


Wider area history

Matched on district and transaction only — property types combined (broader)

Recent · Source-published asking history

batdongsan.com.vn · 6, Hcmc · VND/m² · 2019-09 – 2026-07 · 66 points · median across the property types available for this district, with the type spread; a BROADER match than a single typed series and labelled as such

Broad historical market context · A wider area series aggregated across the property types in this district. Not specific to this property.

050M100M150M200M250M2019-09 · Median across property types 106M VND/m² · spread across the property types (not quartiles): 106M VND/m² – 106M VND/m² · Contributing property types 1 · First period - no prior period to compare2019-10 · Median across property types 113M VND/m² · spread across the property types (not quartiles): 113M VND/m² – 113M VND/m² · Contributing property types 1 · Rose 6.6% vs 2019-092019-11 · Median across property types 112M VND/m² · spread across the property types (not quartiles): 112M VND/m² – 112M VND/m² · Contributing property types 1 · Materially unchanged vs 2019-102020-01 · Median across property types 112M VND/m² · spread across the property types (not quartiles): 112M VND/m² – 112M VND/m² · Contributing property types 1 · Not comparable - the preceding period is missing from the evidence, and the gap is preserved2020-03 · Median across property types 115M VND/m² · spread across the property types (not quartiles): 115M VND/m² – 115M VND/m² · Contributing property types 1 · Not comparable - the preceding period is missing from the evidence, and the gap is preserved2020-05 · Median across property types 113M VND/m² · spread across the property types (not quartiles): 113M VND/m² – 113M VND/m² · Contributing property types 1 · Not comparable - the preceding period is missing from the evidence, and the gap is preserved2020-06 · Median across property types 114M VND/m² · spread across the property types (not quartiles): 114M VND/m² – 114M VND/m² · Contributing property types 1 · Materially unchanged vs 2020-052020-08 · Median across property types 109M VND/m² · spread across the property types (not quartiles): 109M VND/m² – 109M VND/m² · Contributing property types 1 · Not comparable - the preceding period is missing from the evidence, and the gap is preserved2020-09 · Median across property types 107M VND/m² · spread across the property types (not quartiles): 107M VND/m² – 107M VND/m² · Contributing property types 1 · Fell 1.8% vs 2020-082020-10 · Median across property types 106M VND/m² · spread across the property types (not quartiles): 106M VND/m² – 106M VND/m² · Contributing property types 1 · Materially unchanged vs 2020-092020-11 · Median across property types 107M VND/m² · spread across the property types (not quartiles): 107M VND/m² – 107M VND/m² · Contributing property types 1 · Materially unchanged vs 2020-102021-02 · Median across property types 111M VND/m² · spread across the property types (not quartiles): 111M VND/m² – 111M VND/m² · Contributing property types 1 · Not comparable - the preceding period is missing from the evidence, and the gap is preserved2021-Q2 · Median across property types 89.6M VND/m² · spread across the property types (not quartiles): 89.6M VND/m² – 89.6M VND/m² · Contributing property types 1 · Not comparable - the preceding period is missing from the evidence, and the gap is preserved2021-04 · Median across property types 104M VND/m² · spread across the property types (not quartiles): 104M VND/m² – 104M VND/m² · Contributing property types 1 · Not comparable - the preceding period is missing from the evidence, and the gap is preserved2021-Q3 · Median across property types 89.6M VND/m² · spread across the property types (not quartiles): 89.6M VND/m² – 89.6M VND/m² · Contributing property types 1 · Not comparable - the preceding period is missing from the evidence, and the gap is preserved2021-08 · Median across property types 121M VND/m² · spread across the property types (not quartiles): 121M VND/m² – 121M VND/m² · Contributing property types 1 · Not comparable - the preceding period is missing from the evidence, and the gap is preserved2021-09 · Median across property types 124M VND/m² · spread across the property types (not quartiles): 124M VND/m² – 124M VND/m² · Contributing property types 1 · Rose 2.5% vs 2021-082021-Q4 · Median across property types 90.8M VND/m² · spread across the property types (not quartiles): 90.8M VND/m² – 90.8M VND/m² · Contributing property types 1 · Not comparable - the preceding period is missing from the evidence, and the gap is preserved2021-10 · Median across property types 125M VND/m² · spread across the property types (not quartiles): 125M VND/m² – 125M VND/m² · Contributing property types 1 · Not comparable - the preceding period is missing from the evidence, and the gap is preserved2021-12 · Median across property types 106M VND/m² · spread across the property types (not quartiles): 106M VND/m² – 106M VND/m² · Contributing property types 1 · Not comparable - the preceding period is missing from the evidence, and the gap is preserved2022-Q1 · Median across property types 117.2M VND/m² · spread across the property types (not quartiles): 103M VND/m² – 131.3M VND/m² · Contributing property types 2 · Not comparable - the preceding period is missing from the evidence, and the gap is preserved2022-01 · Median across property types 94.4M VND/m² · spread across the property types (not quartiles): 94.4M VND/m² – 94.4M VND/m² · Contributing property types 1 · Not comparable - the preceding period is missing from the evidence, and the gap is preserved2022-Q2 · Median across property types 141.2M VND/m² · spread across the property types (not quartiles): 119.3M VND/m² – 163.1M VND/m² · Contributing property types 2 · Not comparable - the preceding period is missing from the evidence, and the gap is preserved2022-05 · Median across property types 102M VND/m² · spread across the property types (not quartiles): 102M VND/m² – 102M VND/m² · Contributing property types 1 · Not comparable - the preceding period is missing from the evidence, and the gap is preserved2022-Q3 · Median across property types 146.3M VND/m² · spread across the property types (not quartiles): 122.1M VND/m² – 170.4M VND/m² · Contributing property types 2 · Not comparable - the preceding period is missing from the evidence, and the gap is preserved2022-07 · Median across property types 102M VND/m² · spread across the property types (not quartiles): 102M VND/m² – 102M VND/m² · Contributing property types 1 · Not comparable - the preceding period is missing from the evidence, and the gap is preserved2022-08 · Median across property types 69.4M VND/m² · spread across the property types (not quartiles): 69.4M VND/m² – 69.4M VND/m² · Contributing property types 1 · Fell 32.0% vs 2022-072022-Q4 · Median across property types 139.2M VND/m² · spread across the property types (not quartiles): 107.9M VND/m² – 170.4M VND/m² · Contributing property types 2 · Not comparable - the preceding period is missing from the evidence, and the gap is preserved2022-10 · Median across property types 40.2M VND/m² · spread across the property types (not quartiles): 40.2M VND/m² – 40.2M VND/m² · Contributing property types 1 · Not comparable - the preceding period is missing from the evidence, and the gap is preserved2022-11 · Median across property types 25.9M VND/m² · spread across the property types (not quartiles): 25.9M VND/m² – 25.9M VND/m² · Contributing property types 1 · Fell 35.6% vs 2022-102022-12 · Median across property types 25.9M VND/m² · spread across the property types (not quartiles): 25.9M VND/m² – 25.9M VND/m² · Contributing property types 1 · Materially unchanged vs 2022-112023-Q1 · Median across property types 144.2M VND/m² · spread across the property types (not quartiles): 118M VND/m² – 170.4M VND/m² · Contributing property types 2 · Not comparable - the preceding period is missing from the evidence, and the gap is preserved2023-02 · Median across property types 25.9M VND/m² · spread across the property types (not quartiles): 25.9M VND/m² – 25.9M VND/m² · Contributing property types 1 · Not comparable - the preceding period is missing from the evidence, and the gap is preserved2023-03 · Median across property types 25.9M VND/m² · spread across the property types (not quartiles): 25.9M VND/m² – 25.9M VND/m² · Contributing property types 1 · Materially unchanged vs 2023-022023-Q2 · Median across property types 128.6M VND/m² · spread across the property types (not quartiles): 112.7M VND/m² – 144.4M VND/m² · Contributing property types 2 · Not comparable - the preceding period is missing from the evidence, and the gap is preserved2023-04 · Median across property types 25.9M VND/m² · spread across the property types (not quartiles): 25.9M VND/m² – 25.9M VND/m² · Contributing property types 1 · Not comparable - the preceding period is missing from the evidence, and the gap is preserved2023-05 · Median across property types 25.9M VND/m² · spread across the property types (not quartiles): 25.9M VND/m² – 25.9M VND/m² · Contributing property types 1 · Materially unchanged vs 2023-042023-Q3 · Median across property types 114.5M VND/m² · spread across the property types (not quartiles): 96M VND/m² – 133M VND/m² · Contributing property types 2 · Not comparable - the preceding period is missing from the evidence, and the gap is preserved2023-Q4 · Median across property types 123.4M VND/m² · spread across the property types (not quartiles): 95M VND/m² – 151.8M VND/m² · Contributing property types 2 · Rose 7.8% vs 2023-Q32024-Q1 · Median across property types 137.7M VND/m² · spread across the property types (not quartiles): 116.6M VND/m² – 158.7M VND/m² · Contributing property types 2 · Rose 11.5% vs 2023-Q42024-03 · Median across property types 102M VND/m² · spread across the property types (not quartiles): 102M VND/m² – 102M VND/m² · Contributing property types 1 · Not comparable - the preceding period is missing from the evidence, and the gap is preserved2024-Q2 · Median across property types 133M VND/m² · spread across the property types (not quartiles): 130.9M VND/m² – 135.1M VND/m² · Contributing property types 2 · Not comparable - the preceding period is missing from the evidence, and the gap is preserved2024-05 · Median across property types 102M VND/m² · spread across the property types (not quartiles): 102M VND/m² – 102M VND/m² · Contributing property types 1 · Not comparable - the preceding period is missing from the evidence, and the gap is preserved2024-Q3 · Median across property types 131.2M VND/m² · spread across the property types (not quartiles): 112.4M VND/m² – 149.9M VND/m² · Contributing property types 2 · Not comparable - the preceding period is missing from the evidence, and the gap is preserved2024-07 · Median across property types 102M VND/m² · spread across the property types (not quartiles): 102M VND/m² – 102M VND/m² · Contributing property types 1 · Not comparable - the preceding period is missing from the evidence, and the gap is preserved2024-08 · Median across property types 102M VND/m² · spread across the property types (not quartiles): 102M VND/m² – 102M VND/m² · Contributing property types 1 · Materially unchanged vs 2024-072024-09 · Median across property types 102M VND/m² · spread across the property types (not quartiles): 102M VND/m² – 102M VND/m² · Contributing property types 1 · Materially unchanged vs 2024-082024-Q4 · Median across property types 126.7M VND/m² · spread across the property types (not quartiles): 112.6M VND/m² – 140.7M VND/m² · Contributing property types 2 · Not comparable - the preceding period is missing from the evidence, and the gap is preserved2024-10 · Median across property types 102M VND/m² · spread across the property types (not quartiles): 102M VND/m² – 102M VND/m² · Contributing property types 1 · Not comparable - the preceding period is missing from the evidence, and the gap is preserved2024-11 · Median across property types 102M VND/m² · spread across the property types (not quartiles): 102M VND/m² – 102M VND/m² · Contributing property types 1 · Materially unchanged vs 2024-102025-Q1 · Median across property types 142.9M VND/m² · spread across the property types (not quartiles): 116.8M VND/m² – 169M VND/m² · Contributing property types 2 · Not comparable - the preceding period is missing from the evidence, and the gap is preserved2025-01 · Median across property types 102M VND/m² · spread across the property types (not quartiles): 102M VND/m² – 102M VND/m² · Contributing property types 1 · Not comparable - the preceding period is missing from the evidence, and the gap is preserved2025-Q2 · Median across property types 149.2M VND/m² · spread across the property types (not quartiles): 114.2M VND/m² – 184.2M VND/m² · Contributing property types 2 · Not comparable - the preceding period is missing from the evidence, and the gap is preserved2025-04 · Median across property types 102M VND/m² · spread across the property types (not quartiles): 102M VND/m² – 102M VND/m² · Contributing property types 1 · Not comparable - the preceding period is missing from the evidence, and the gap is preserved2025-Q3 · Median across property types 134.1M VND/m² · spread across the property types (not quartiles): 106.4M VND/m² – 161.7M VND/m² · Contributing property types 2 · Not comparable - the preceding period is missing from the evidence, and the gap is preserved2025-07 · Median across property types 102M VND/m² · spread across the property types (not quartiles): 102M VND/m² – 102M VND/m² · Contributing property types 1 · Not comparable - the preceding period is missing from the evidence, and the gap is preserved2025-08 · Median across property types 102M VND/m² · spread across the property types (not quartiles): 102M VND/m² – 102M VND/m² · Contributing property types 1 · Materially unchanged vs 2025-072025-Q4 · Median across property types 149.4M VND/m² · spread across the property types (not quartiles): 122.8M VND/m² – 175.9M VND/m² · Contributing property types 2 · Not comparable - the preceding period is missing from the evidence, and the gap is preserved2025-10 · Median across property types 102M VND/m² · spread across the property types (not quartiles): 102M VND/m² – 102M VND/m² · Contributing property types 1 · Not comparable - the preceding period is missing from the evidence, and the gap is preserved2025-11 · Median across property types 102M VND/m² · spread across the property types (not quartiles): 102M VND/m² – 102M VND/m² · Contributing property types 1 · Materially unchanged vs 2025-102025-12 · Median across property types 102M VND/m² · spread across the property types (not quartiles): 102M VND/m² – 102M VND/m² · Contributing property types 1 · Materially unchanged vs 2025-112026-Q1 · Median across property types 154.4M VND/m² · spread across the property types (not quartiles): 125.5M VND/m² – 183.3M VND/m² · Contributing property types 2 · Not comparable - the preceding period is missing from the evidence, and the gap is preserved2026-02 · Median across property types 102M VND/m² · spread across the property types (not quartiles): 102M VND/m² – 102M VND/m² · Contributing property types 1 · Not comparable - the preceding period is missing from the evidence, and the gap is preserved2026-03 · Median across property types 102M VND/m² · spread across the property types (not quartiles): 102M VND/m² – 102M VND/m² · Contributing property types 1 · Materially unchanged vs 2026-022026-Q2 · Median across property types 174.2M VND/m² · spread across the property types (not quartiles): 110.4M VND/m² – 238M VND/m² · Contributing property types 2 · Not comparable - the preceding period is missing from the evidence, and the gap is preserved2026-07 · Median across property types 102M VND/m² · spread across the property types (not quartiles): 102M VND/m² – 102M VND/m² · Contributing property types 1 · Not comparable - the preceding period is missing from the evidence, and the gap is preserved2019-092021-042022-082024-Q12025-Q22026-07VND/m²
050M100M150M200M250M2019-092023-032026-07VND/m²
median rosemedian fellunchanged
Period
2026-07
Median across property types
102M VND/m²
spread across the property types (not quartiles)
102M VND/m² – 102M VND/m²
Contributing property types
1
Direction
Not comparable - the preceding period is missing from the evidence, and the gap is preserved
Matching level
Matched on district and transaction only — property types combined (broader)
Geography
6, Ho Chi Minh City
Property type
All property types in the district
Transaction
For sale

Tap or hover a period to read its figures here.

median rosemedian fellunchangedno preceding period (line breaks at a gap)weak sample (n≤3), still shownspread across the property types (not quartiles)
2025-12102M VND/m² · n=1
2026-Q1154.4M VND/m² · n=2
2026-02102M VND/m² · n=1
2026-03102M VND/m² · n=1
2026-Q2174.2M VND/m² · n=2
2026-07102M VND/m² · n=1

How Giá Thật records this

This is the publicly recorded asking price, not a transaction price and not a valuation. Most recent observation: 11/08/2026. Location is shown at district and city/province level.
Data source · Listing criteria · Report / flag this listing

Similar listings

More on Giá Thật