Apartment / condo for rent in 7, TP. Hồ Chí Minh

18,000,000 VND / mo

Apartment / condo · For rent · 7, TP. Hồ Chí Minh · 72 m² (floor) · 2 bd
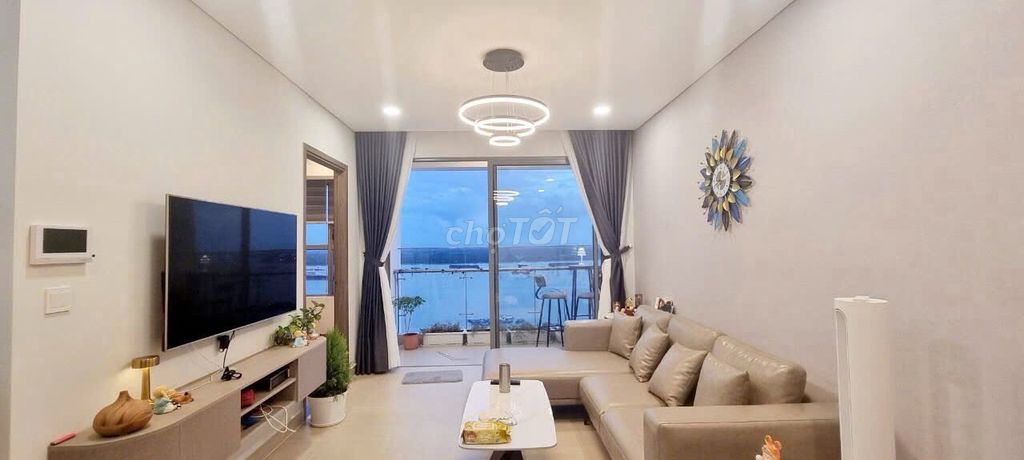
Apartment / condo in 7, TP. Hồ Chí Minh - photo 1Apartment / condo in 7, TP. Hồ Chí Minh - photo 2Apartment / condo in 7, TP. Hồ Chí Minh - photo 3Apartment / condo in 7, TP. Hồ Chí Minh - photo 4Apartment / condo in 7, TP. Hồ Chí Minh - photo 5

Property details

TypeApartment / condo
Listing typeFor rent
Area72 m² (floor)
Bedrooms2
Bathrooms2
Unit price250,000 VND/m²/mo (floor)
ProjectSky 89 An Gia
Location7, TP. Hồ Chí Minh

Source listing title

CHO THUÊ 2PN FULL NT 18TR CHUNG CƯ SKY89 Q7

Original source

↗ Open original listing

Contact the seller

Contact the seller on the source ↗

Giá Thật has no public phone number recorded for this listing; the seller is reached through the original listing on nhatot.com. On Nhà Tốt the phone number appears after pressing “show number”.

Share this listing

Price summary (for reference)

Technical details

Province-wide asking-price context — snapshot of the current package (observations 30/08/2026 – 01/09/2026)

Broad current-supply context for this transaction only—not a valuation or an individual-property history. THIS BLOCK is province-wide and combines every property type, so it is deliberately not joined to typed historical evidence. The property type used further down, Apartment / condo, is taken from the source’s own category field — not an independently verified canonical field.

Broad current market context · All current listings for ONE transaction across the province, property types combined. Not a valuation.

TransactionFor rent
As ofObservations 30/08/2026 – 01/09/2026 (package 5e5e15a7; the same package as the comparable basket below)
Province/cityTP. Hồ Chí Minh
Current listings23,755
Rounded median asking price6 M VND
Middle 50% total asking price4 M VND – 15 M VND
Usable price observations20,062
Unknown asking price454

Observed listing asking prices only; Tukey 1.5×IQR filtering. SALE and RENT stay separate. No interpolation, transaction/declaration prices, tax/notarial values or government price table.

Comparable asking prices — 2026-Q3 snapshot (observed 30/08/2026 – 01/09/2026; GIÁ THẬT observations)

This listing's asking price per m²250k VND/m²/month (separate marker, not part of the basket)
Comparable basket, weighted median149k VND/m²/month — 2026-Q3 (observed 30/08/2026 – 01/09/2026) · 405 comparables · province-wide
Middle 50% of comparables (p25–p75)120k VND/m²/month – 200k VND/m²/month
Where this listing sitswell above the middle band (+68.2% vs weighted median)
Comparables used405 (10 outliers removed)
Observation period2026-Q3 (30/08/2026 → 01/09/2026)
CohortApartment / condo · For rent · 60–80 m² · same province — no district was found in this listing's title or description, so the comparison is province-wide; the listing's stated district (7) is not used by this comparison
Confidencemedium (3/12 factors demonstrated, effective n 367.8)

Estimated range for this property's area: 9 M VND – 14 M VND (median 11 M VND)/month. This is an ESTIMATE derived from the comparable basket × the stated area — not an observed price, not a valuation, not a transaction price. Basis: basket p25 – p75 of the 2026-Q3 snapshot (observed 30/08/2026 – 01/09/2026) × 72 m² stated area.

Features that weighted this basket (stated by both this listing and the comparables): area · bedrooms · evidence quality

Not stated by this listing, so not used: main street / alley · alley width · car access · frontage width · corner position · floors · legal status · ward · street. Unknown is never counted as a match; it lowers the confidence.

Asking-price observations collected by GIÁ THẬT from public listings, SALE and RENT kept apart; weighted median after a log-space Tukey 1.5×IQR fence; no interpolation, no government, tax, notarial or declared-transaction values. Comparable evidence, not this property's own history.

Asking-price context

Comparable asking range (earlier per-listing estimate, listing observed 11/08/2026)10.1 M VND – 17.6 M VND
Current asking price18,000,000 VND

Separate, earlier per-listing estimate retained from the static package; it is not the dated comparable basket shown above and carries no cohort or period of its own.

Asking-price evidence from comparable listings in this area/segment; not an individual-property valuation and not a transaction price.

Comparable market asking-price history

Comparable-market timeline (GIÁ THẬT observations, 2023-Q1 → 2026-Q4; province-wide, same type · transaction · area band)

2026-Q4 is the current quarter, partial (observations through 2026-10-21); its point is not a full-quarter figure.

One point per quarter: the weighted median asking VND/m² of comparable listings GIÁ THẬT itself observed (same type, transaction, area band, same province; the same attribute weights as the recent basket). Real dated observations only: nothing is interpolated, backcast or merged with the archive series below. Quarters without a defensible basket draw no point (12 of 28 quarters in the index): 2020-Q1, 2020-Q2, 2020-Q3, 2020-Q4, 2021-Q1, 2021-Q2, 2021-Q3, 2021-Q4, ….

Comparable series matched to this property · Selected on location, property type, transaction and area band, and weighted. Still market evidence, not this property's own sale history.

100,000150,000200,000250,0002023-Q1 · Weighted median 155,844 VND/m²/month · P25 - P75 of comparable asking prices: 130,769 VND/m²/month – 207,792 VND/m²/month · Observations 66 · First period - no prior period to compare2023-Q2 · Weighted median 153,846 VND/m²/month · P25 - P75 of comparable asking prices: 115,942 VND/m²/month – 191,176 VND/m²/month · Observations 124 · Materially unchanged vs 2023-Q12023-Q3 · Weighted median 157,143 VND/m²/month · P25 - P75 of comparable asking prices: 128,571 VND/m²/month – 213,333 VND/m²/month · Observations 123 · Rose 2.1% vs 2023-Q22023-Q4 · Weighted median 146,154 VND/m²/month · P25 - P75 of comparable asking prices: 121,429 VND/m²/month – 200,000 VND/m²/month · Observations 115 · Fell 7.0% vs 2023-Q32024-Q1 · Weighted median 197,368 VND/m²/month · P25 - P75 of comparable asking prices: 134,328 VND/m²/month – 250,000 VND/m²/month · Observations 195 · Rose 35.0% vs 2023-Q42024-Q2 · Weighted median 171,429 VND/m²/month · P25 - P75 of comparable asking prices: 134,615 VND/m²/month – 226,667 VND/m²/month · Observations 270 · Fell 13.1% vs 2024-Q12024-Q3 · Weighted median 153,333 VND/m²/month · P25 - P75 of comparable asking prices: 135,714 VND/m²/month – 169,231 VND/m²/month · Observations 283 · Fell 10.6% vs 2024-Q22024-Q4 · Weighted median 154,930 VND/m²/month · P25 - P75 of comparable asking prices: 130,000 VND/m²/month – 187,500 VND/m²/month · Observations 288 · Materially unchanged vs 2024-Q32025-Q1 · Weighted median 153,846 VND/m²/month · P25 - P75 of comparable asking prices: 129,870 VND/m²/month – 194,030 VND/m²/month · Observations 297 · Materially unchanged vs 2024-Q42025-Q2 · Weighted median 171,429 VND/m²/month · P25 - P75 of comparable asking prices: 126,667 VND/m²/month – 217,105 VND/m²/month · Observations 300 · Rose 11.4% vs 2025-Q12025-Q3 · Weighted median 171,053 VND/m²/month · P25 - P75 of comparable asking prices: 136,986 VND/m²/month – 215,190 VND/m²/month · Observations 295 · Materially unchanged vs 2025-Q22025-Q4 · Weighted median 166,667 VND/m²/month · P25 - P75 of comparable asking prices: 128,571 VND/m²/month – 226,667 VND/m²/month · Observations 295 · Fell 2.6% vs 2025-Q32026-Q1 · Weighted median 169,118 VND/m²/month · P25 - P75 of comparable asking prices: 128,571 VND/m²/month – 228,571 VND/m²/month · Observations 292 · Materially unchanged vs 2025-Q42026-Q2 · Weighted median 161,765 VND/m²/month · P25 - P75 of comparable asking prices: 136,986 VND/m²/month – 213,333 VND/m²/month · Observations 288 · Fell 4.3% vs 2026-Q12026-Q3 · Weighted median 147,887 VND/m²/month · P25 - P75 of comparable asking prices: 121,622 VND/m²/month – 186,667 VND/m²/month · Observations 281 · Fell 8.6% vs 2026-Q22026-Q4 · Weighted median 169,355 VND/m²/month · P25 - P75 of comparable asking prices: 131,579 VND/m²/month – 220,000 VND/m²/month · Observations 297 · Rose 14.5% vs 2026-Q3this property 250,000 VND/m²/month2023-Q12023-Q42024-Q32025-Q22026-Q12026-Q4VND/m²/month
100,000150,000200,000250,000this property 250,000 VND/m²/month2023-Q12025-Q12026-Q4VND/m²/month
weighted median roseweighted median fellunchanged
Period
2026-Q4
Weighted median
169,355 VND/m²/month
P25 - P75 of comparable asking prices
131,579 VND/m²/month – 220,000 VND/m²/month
Observations
297
Direction
Rose 14.5% vs 2026-Q3
Matching level
same province
Confidence
medium (0.60)
Geography
Ho Chi Minh City
Property type
Apartment / condo
Transaction
For rent
Evidence class
Dated asking prices observed by Giá Thật

Tap or hover a period to read its figures here.

weighted median roseweighted median fellunchangedP25-P75 of comparable asking pricesthis property
2025-Q1153,846 VND/m²/month · 297 listings · confidence medium
2025-Q2171,429 VND/m²/month · 300 listings · confidence medium
2025-Q3171,053 VND/m²/month · 295 listings · confidence medium
2025-Q4166,667 VND/m²/month · 295 listings · confidence medium
2026-Q1169,118 VND/m²/month · 292 listings · confidence medium
2026-Q2161,765 VND/m²/month · 288 listings · confidence medium
2026-Q3147,887 VND/m²/month · 281 listings · confidence medium
2026-Q4169,355 VND/m²/month · 297 listings · confidence medium

Methodology boundary. The series below this line is the ARCHIVE comparable basket (historical package, pre-2021 asking observations, its own basket construction). It is kept as evidence and is NOT stitched onto the timeline above.

Comparable-market evidence selected for this property. It is not this individual property's own transaction history. Evidence classes are shown separately, gaps are preserved and nothing is interpolated. Government, tax and notarial prices are excluded.

Recent context

The wider-area history has no sufficiently matched recent evidence for this property. The wider-area history ends 2020-Q3, about 72 months before the newest evidence Giá Thật holds (2026-Q3). This gap is retained as unfinished work: nothing is extrapolated and no broader series is passed off as this property's market.

Broader recent context (clearly labelled)

2026-Q2 · 56,400,000 VND/month — median across the property types available for this district, with the type spread; a BROADER match than a single typed series and labelled as such · batdongsan.com.vn

Latest period: 2026-Q2Geography: 7, Hcmc (same district as this listing)Property type: all property types in the district combined — NOT matched to this listing's type (Apartment / condo)Transaction: For rentSample basis: 4 contributing typed series in the latest period (no listing-level sample size published)

The full series is charted below under “Wider area history” (first block). The older archive (to 2020-Q3) is shown separately below and is never joined to it.

* 20Y is unavailable: the observed evidence spans 14 years.

Matched: Comparable basket matched to this propertyLatest evidence: 2020-Q3Based on: 203 comparables from 134 distinct listingsConfidence: medium

This series is archived: its newest observation is 2020-Q3, about 72 months before the most recent evidence Giá Thật holds. It describes the market of that period, not today's asking prices.

Comparable basket matched to this property — Quận 7, Tp.HCM · apartment_condo · RENT · 60-80m2

Span 2013-Q1 – 2020-Q3 (7.5 years) · 203 comparables from 134 distinct listings · VND/m²/month

This property's current asking price: 250,000 VND/m²/month (18,000,000 VND / month ÷ 72 m²) (shown as the dashed marker, not as a point in the series)

Features that selected and weighted this basket: province: HCMC · district: 7 · property type: Apartment / condo · transaction: RENT · area similarity: 60-80m2 (72 m²) · evidence quality

Not available in this evidence, so not used: road / access width · frontage width · corner position · floors / bedrooms / condition · legal / ownership evidence · depth / shape. These lower the confidence below; they are never counted as matches.

weighted median of observed asking price per m2 per calendar quarter; weight = area_similarity x evidence_quality, and low/high are WEIGHTED p25/p75 computed with those same weights; recency is carried by the quarter bucket itself rather than by a within-bucket factor, and the locality/project signal the pool carries is deliberately NOT in the weight because using it would move published medians without re-validation; low/high are p25/p75 of the weighted comparables in that quarter

Comparable series matched to this property · Selected on location, property type, transaction and area band, and weighted. Still market evidence, not this property's own sale history.

050M100M150M200M2013-Q1 · Weighted median 144,737 VND/m²/month · P25 - P75 of comparable asking prices: 109,091 VND/m²/month – 154,930 VND/m²/month · Comparables 4 · First period - no prior period to compare2013-Q2 · Weighted median 74,627 VND/m²/month · P25 - P75 of comparable asking prices: 59,701 VND/m²/month – 131,579 VND/m²/month · Comparables 7 · Fell 48.4% vs 2013-Q12013-Q3 · Weighted median 67,164 VND/m²/month · P25 - P75 of comparable asking prices: 59,701 VND/m²/month – 67,164 VND/m²/month · Comparables 18 · Fell 10.0% vs 2013-Q22014-Q4 · Weighted median 200,000 VND/m²/month · P25 - P75 of comparable asking prices: 71,642 VND/m²/month – 217M VND/m²/month · Comparables 4 · Not comparable - the preceding period is missing from the evidence, and the gap is preserved2015-Q1 · Weighted median 200,000 VND/m²/month · P25 - P75 of comparable asking prices: 100,000 VND/m²/month – 231,667 VND/m²/month · Comparables 16 · Materially unchanged vs 2014-Q42015-Q2 · Weighted median 200,714 VND/m²/month · P25 - P75 of comparable asking prices: 95,588 VND/m²/month – 230,000 VND/m²/month · Comparables 11 · Materially unchanged vs 2015-Q12015-Q3 · Weighted median 210,526 VND/m²/month · P25 - P75 of comparable asking prices: 177,632 VND/m²/month – 223,684 VND/m²/month · Comparables 19 · Rose 4.9% vs 2015-Q22015-Q4 · Weighted median 185,714 VND/m²/month · P25 - P75 of comparable asking prices: 131,579 VND/m²/month – 210,526 VND/m²/month · Comparables 39 · Fell 11.8% vs 2015-Q32016-Q1 · Weighted median 197,368 VND/m²/month · P25 - P75 of comparable asking prices: 173,099 VND/m²/month – 236,842 VND/m²/month · Comparables 16 · Rose 6.3% vs 2015-Q42017-Q2 · Weighted median 188,312 VND/m²/month · P25 - P75 of comparable asking prices: 169,014 VND/m²/month – 200,000 VND/m²/month · Comparables 4 · Not comparable - the preceding period is missing from the evidence, and the gap is preserved2018-Q1 · Weighted median 136,986 VND/m²/month · P25 - P75 of comparable asking prices: 134,328 VND/m²/month – 179,487 VND/m²/month · Comparables 8 · Not comparable - the preceding period is missing from the evidence, and the gap is preserved2019-Q2 · Weighted median 136,986 VND/m²/month · P25 - P75 of comparable asking prices: 136,986 VND/m²/month – 164,384 VND/m²/month · Comparables 4 · Not comparable - the preceding period is missing from the evidence, and the gap is preserved2019-Q3 · Weighted median 128,571 VND/m²/month · P25 - P75 of comparable asking prices: 123,288 VND/m²/month – 210,526 VND/m²/month · Comparables 16 · Fell 6.1% vs 2019-Q22019-Q4 · Weighted median 128,571 VND/m²/month · P25 - P75 of comparable asking prices: 101,493 VND/m²/month – 173,913 VND/m²/month · Comparables 10 · Materially unchanged vs 2019-Q32020-Q1 · Weighted median 128,571 VND/m²/month · P25 - P75 of comparable asking prices: 107,692 VND/m²/month – 136,986 VND/m²/month · Comparables 9 · Materially unchanged vs 2019-Q42020-Q2 · Weighted median 184,211 VND/m²/month · P25 - P75 of comparable asking prices: 184,211 VND/m²/month – 197,368 VND/m²/month · Comparables 13 · Rose 43.3% vs 2020-Q12020-Q3 · Weighted median 128,205 VND/m²/month · P25 - P75 of comparable asking prices: 104,478 VND/m²/month – 130,137 VND/m²/month · Comparables 5 · Fell 30.4% vs 2020-Q2this property 250,000 VND/m²/month2013-Q12014-Q42015-Q32018-Q12019-Q42020-Q3VND/m²/month
050M100M150M200Mthis property 250,000 VND/m²/month2013-Q12016-Q12020-Q3VND/m²/month
weighted median roseweighted median fellunchanged
Period
2020-Q3
Weighted median
128,205 VND/m²/month
P25 - P75 of comparable asking prices
104,478 VND/m²/month – 130,137 VND/m²/month
Comparables
5
Distinct listings behind it
5
Direction
Fell 30.4% vs 2020-Q2
Matching level
Comparable basket matched to this property
Confidence
medium (0.50)
Geography
Quận 7, Tp.HCM
Property type
Apartment / condo
Transaction
For rent
Evidence class
Archived asking prices

Tap or hover a period to read its figures here.

weighted median roseweighted median fellunchangedno preceding period (line breaks at a gap)P25-P75 of comparable asking pricesthis property
2017-Q2188,312 VND/m²/month (169,014 VND/m²/month – 200,000 VND/m²/month) · n=4
2018-Q1136,986 VND/m²/month (134,328 VND/m²/month – 179,487 VND/m²/month) · n=8
2019-Q2136,986 VND/m²/month (136,986 VND/m²/month – 164,384 VND/m²/month) · n=4
2019-Q3128,571 VND/m²/month (123,288 VND/m²/month – 210,526 VND/m²/month) · n=16
2019-Q4128,571 VND/m²/month (101,493 VND/m²/month – 173,913 VND/m²/month) · n=10
2020-Q1128,571 VND/m²/month (107,692 VND/m²/month – 136,986 VND/m²/month) · n=9
2020-Q2184,211 VND/m²/month (184,211 VND/m²/month – 197,368 VND/m²/month) · n=13
2020-Q3128,205 VND/m²/month (104,478 VND/m²/month – 130,137 VND/m²/month) · n=5

Confidence: medium (0.5) · confidence is capped by demonstrated specificity: 6 of 12 contract score components are effective for THIS cohort. A component absent from this cohort - a district that was never matched, for instance - is not counted, and recency is not counted because it is carried by the quarter bucket rather than by a within-bucket weight.


Wider area history

Matched on district, property type and transaction

Broader context (all property types in the district) · Source-published asking history

batdongsan.com.vn · 7, Hcmc · VND/month · 2021-Q2 – 2026-Q2 · 21 points · median across the property types available for this district, with the type spread; a BROADER match than a single typed series and labelled as such

Broader context only: this series combines all property types in the district and is NOT matched to this listing's type. It is shown because no type-matched series reaches the recent period; that type-matched gap remains unfinished work.

Broad historical market context · A wider area series aggregated across the property types in this district. Not specific to this property.

050M100M150M2021-Q2 · Median across property types 12,900,000 VND/month · spread across the property types (not quartiles): 4,000,000 VND/month – 48,100,000 VND/month · Contributing property types 3 · First period - no prior period to compare2021-Q3 · Median across property types 12,900,000 VND/month · spread across the property types (not quartiles): 5,000,000 VND/month – 52,700,000 VND/month · Contributing property types 3 · Materially unchanged vs 2021-Q22021-Q4 · Median across property types 54,200,000 VND/month · spread across the property types (not quartiles): 5,000,000 VND/month – 98,100,000 VND/month · Contributing property types 3 · Rose 320.2% vs 2021-Q32022-Q1 · Median across property types 30,100,000 VND/month · spread across the property types (not quartiles): 5,000,000 VND/month – 51,200,000 VND/month · Contributing property types 3 · Fell 44.5% vs 2021-Q42022-Q2 · Median across property types 46,300,000 VND/month · spread across the property types (not quartiles): 5,000,000 VND/month – 63,700,000 VND/month · Contributing property types 4 · Rose 53.8% vs 2022-Q12022-Q3 · Median across property types 37,400,000 VND/month · spread across the property types (not quartiles): 6,000,000 VND/month – 53,000,000 VND/month · Contributing property types 4 · Fell 19.2% vs 2022-Q22022-Q4 · Median across property types 39,650,000 VND/month · spread across the property types (not quartiles): 6,000,000 VND/month – 65,200,000 VND/month · Contributing property types 4 · Rose 6.0% vs 2022-Q32023-Q1 · Median across property types 40,550,000 VND/month · spread across the property types (not quartiles): 6,000,000 VND/month – 65,800,000 VND/month · Contributing property types 4 · Rose 2.3% vs 2022-Q42023-Q2 · Median across property types 36,150,000 VND/month · spread across the property types (not quartiles): 6,000,000 VND/month – 79,000,000 VND/month · Contributing property types 4 · Fell 10.9% vs 2023-Q12023-Q3 · Median across property types 58,700,000 VND/month · spread across the property types (not quartiles): 6,000,000 VND/month – 100,800,000 VND/month · Contributing property types 5 · Rose 62.4% vs 2023-Q22023-Q4 · Median across property types 48,600,000 VND/month · spread across the property types (not quartiles): 7,000,000 VND/month – 63,300,000 VND/month · Contributing property types 5 · Fell 17.2% vs 2023-Q32024-Q1 · Median across property types 51,000,000 VND/month · spread across the property types (not quartiles): 6,000,000 VND/month – 72,300,000 VND/month · Contributing property types 5 · Rose 4.9% vs 2023-Q42024-Q2 · Median across property types 60,200,000 VND/month · spread across the property types (not quartiles): 6,000,000 VND/month – 76,400,000 VND/month · Contributing property types 5 · Rose 18.0% vs 2024-Q12024-Q3 · Median across property types 70,200,000 VND/month · spread across the property types (not quartiles): 6,000,000 VND/month – 78,500,000 VND/month · Contributing property types 5 · Rose 16.6% vs 2024-Q22024-Q4 · Median across property types 68,800,000 VND/month · spread across the property types (not quartiles): 6,000,000 VND/month – 84,300,000 VND/month · Contributing property types 5 · Fell 2.0% vs 2024-Q32025-Q1 · Median across property types 58,800,000 VND/month · spread across the property types (not quartiles): 6,000,000 VND/month – 77,000,000 VND/month · Contributing property types 5 · Fell 14.5% vs 2024-Q42025-Q2 · Median across property types 79,100,000 VND/month · spread across the property types (not quartiles): 6,000,000 VND/month – 89,700,000 VND/month · Contributing property types 5 · Rose 34.5% vs 2025-Q12025-Q3 · Median across property types 64,300,000 VND/month · spread across the property types (not quartiles): 6,000,000 VND/month – 159,800,000 VND/month · Contributing property types 5 · Fell 18.7% vs 2025-Q22025-Q4 · Median across property types 58,000,000 VND/month · spread across the property types (not quartiles): 6,000,000 VND/month – 82,000,000 VND/month · Contributing property types 5 · Fell 9.8% vs 2025-Q32026-Q1 · Median across property types 55,000,000 VND/month · spread across the property types (not quartiles): 6,000,000 VND/month – 96,300,000 VND/month · Contributing property types 4 · Fell 5.2% vs 2025-Q42026-Q2 · Median across property types 56,400,000 VND/month · spread across the property types (not quartiles): 6,000,000 VND/month – 102,700,000 VND/month · Contributing property types 4 · Rose 2.5% vs 2026-Q12021-Q22022-Q22023-Q22024-Q22025-Q22026-Q2VND/month
050M100M150M2021-Q22023-Q42026-Q2VND/month
median rosemedian fellunchanged
Period
2026-Q2
Median across property types
56,400,000 VND/month
spread across the property types (not quartiles)
6,000,000 VND/month – 102,700,000 VND/month
Contributing property types
4
Direction
Rose 2.5% vs 2026-Q1
Matching level
Matched on district and transaction only — property types combined (broader)
Geography
7, Ho Chi Minh City
Property type
All property types in the district
Transaction
For rent

Tap or hover a period to read its figures here.

median rosemedian fellunchangedweak sample (n≤3), still shownspread across the property types (not quartiles)
2025-Q158,800,000 VND/month · n=5
2025-Q279,100,000 VND/month · n=5
2025-Q364,300,000 VND/month · n=5
2025-Q458,000,000 VND/month · n=5
2026-Q155,000,000 VND/month · n=4
2026-Q256,400,000 VND/month · n=4

Archive to 2020-Q3 · Dated archived listing observations

batdongsan.com.vn via web.archive.org · Quận 7, Tp.HCM · VND/month · 2013-Q1 – 2020-Q3 · 22 points · quarterly median with p25/p75 over dated archived asking observations; sample_size is the number of DISTINCT listings in that quarter

Broad historical market context · A wider area series that may combine property types. Not specific to this property.

010M20M30M2013-Q1 · Median 8,000,000 VND/month · P25 - P75 of comparable asking prices: 7,000,000 VND/month – 9,500,000 VND/month · Distinct listings 21 · First period - no prior period to compare2013-Q2 · Median 9,000,000 VND/month · P25 - P75 of comparable asking prices: 5,000,000 VND/month – 10,000,000 VND/month · Distinct listings 12 · Rose 12.5% vs 2013-Q12013-Q3 · Median 4,500,000 VND/month · P25 - P75 of comparable asking prices: 4,000,000 VND/month – 9,000,000 VND/month · Distinct listings 25 · Fell 50.0% vs 2013-Q22014-Q1 · Median 5,000,000 VND/month · P25 - P75 of comparable asking prices: 5,000,000 VND/month – 5,000,000 VND/month · Distinct listings 4 · Not comparable - the preceding period is missing from the evidence, and the gap is preserved2014-Q2 · Median 4,900,000 VND/month · P25 - P75 of comparable asking prices: 4,500,000 VND/month – 14,000,000 VND/month · Distinct listings 7 · Fell 2.0% vs 2014-Q12014-Q4 · Median 10,000,000 VND/month · P25 - P75 of comparable asking prices: 8,000,000 VND/month – 17,060,000 VND/month · Distinct listings 18 · Not comparable - the preceding period is missing from the evidence, and the gap is preserved2015-Q1 · Median 13,500,000 VND/month · P25 - P75 of comparable asking prices: 7,500,000 VND/month – 19,500,000 VND/month · Distinct listings 45 · Rose 35.0% vs 2014-Q42015-Q2 · Median 13,800,000 VND/month · P25 - P75 of comparable asking prices: 12,000,000 VND/month – 16,000,000 VND/month · Distinct listings 23 · Rose 2.2% vs 2015-Q12015-Q3 · Median 15,500,000 VND/month · P25 - P75 of comparable asking prices: 10,500,000 VND/month – 17,000,000 VND/month · Distinct listings 31 · Rose 12.3% vs 2015-Q22015-Q4 · Median 13,000,000 VND/month · P25 - P75 of comparable asking prices: 10,000,000 VND/month – 16,000,000 VND/month · Distinct listings 57 · Fell 16.1% vs 2015-Q32016-Q1 · Median 15,000,000 VND/month · P25 - P75 of comparable asking prices: 12,000,000 VND/month – 18,980,000 VND/month · Distinct listings 21 · Rose 15.4% vs 2015-Q42016-Q3 · Median 13,500,000 VND/month · P25 - P75 of comparable asking prices: 9,000,000 VND/month – 29,000,000 VND/month · Distinct listings 4 · Not comparable - the preceding period is missing from the evidence, and the gap is preserved2016-Q4 · Median 15,000,000 VND/month · P25 - P75 of comparable asking prices: 15,000,000 VND/month – 15,000,000 VND/month · Distinct listings 4 · Rose 11.1% vs 2016-Q32017-Q2 · Median 14,500,000 VND/month · P25 - P75 of comparable asking prices: 12,000,000 VND/month – 15,000,000 VND/month · Distinct listings 5 · Not comparable - the preceding period is missing from the evidence, and the gap is preserved2017-Q3 · Median 14,500,000 VND/month · P25 - P75 of comparable asking prices: 8,000,000 VND/month – 16,000,000 VND/month · Distinct listings 6 · Materially unchanged vs 2017-Q22018-Q1 · Median 10,000,000 VND/month · P25 - P75 of comparable asking prices: 7,000,000 VND/month – 18,000,000 VND/month · Distinct listings 20 · Not comparable - the preceding period is missing from the evidence, and the gap is preserved2019-Q2 · Median 10,000,000 VND/month · P25 - P75 of comparable asking prices: 8,000,000 VND/month – 12,000,000 VND/month · Distinct listings 17 · Not comparable - the preceding period is missing from the evidence, and the gap is preserved2019-Q3 · Median 10,000,000 VND/month · P25 - P75 of comparable asking prices: 8,000,000 VND/month – 13,000,000 VND/month · Distinct listings 33 · Materially unchanged vs 2019-Q22019-Q4 · Median 9,000,000 VND/month · P25 - P75 of comparable asking prices: 6,500,000 VND/month – 15,000,000 VND/month · Distinct listings 36 · Fell 10.0% vs 2019-Q32020-Q1 · Median 8,000,000 VND/month · P25 - P75 of comparable asking prices: 6,500,000 VND/month – 13,000,000 VND/month · Distinct listings 34 · Fell 11.1% vs 2019-Q42020-Q2 · Median 10,500,000 VND/month · P25 - P75 of comparable asking prices: 8,000,000 VND/month – 14,000,000 VND/month · Distinct listings 37 · Rose 31.3% vs 2020-Q12020-Q3 · Median 10,000,000 VND/month · P25 - P75 of comparable asking prices: 7,500,000 VND/month – 14,000,000 VND/month · Distinct listings 19 · Fell 4.8% vs 2020-Q22013-Q12014-Q22015-Q32017-Q22019-Q32020-Q3VND/month
010M20M30M2013-Q12016-Q32020-Q3VND/month
median rosemedian fellunchanged
Period
2020-Q3
Median
10,000,000 VND/month
P25 - P75 of comparable asking prices
7,500,000 VND/month – 14,000,000 VND/month
Distinct listings
19
Direction
Fell 4.8% vs 2020-Q2
Matching level
Matched on district, property type and transaction
Geography
Quận 7, Tp.HCM
Property type
Apartment / condo
Transaction
For rent
Evidence class
Archived asking prices

Tap or hover a period to read its figures here.

median rosemedian fellunchangedno preceding period (line breaks at a gap)P25-P75 of comparable asking prices
2019-Q210,000,000 VND/month · n=17
2019-Q310,000,000 VND/month · n=33
2019-Q49,000,000 VND/month · n=36
2020-Q18,000,000 VND/month · n=34
2020-Q210,500,000 VND/month · n=37
2020-Q310,000,000 VND/month · n=19

How Giá Thật records this

This is the publicly recorded asking price, not a transaction price and not a valuation. Most recent observation: 11/08/2026. Location is shown at district and city/province level.

Data source · Listing criteria · Report / flag this listing

Similar listings

More on Giá Thật